Welcome to StockAverageCalculate.com – Your Ultimate Stock Averaging Solution
Stock Average Calculator
Total Stocks: 0
Total Amount: 0
Average Price: 0
Profit/Loss: 0
Why Use Our Stock Average Calculator?
Are you looking for a quick, easy, and accurate way to calculate your stock average price? Look no further! StockAverageCalculate.com is your go-to online tool for calculating stock averages, stock average down calculator and making more informed investment decisions. Our intuitive platform helps investors like you save time, reduce errors, and take control of your stock market strategies.
For Indepth knowledge, you can read the full article here too “Master the Art of Smart Investing with the Stock Average Calculator“
How It Works
Using our Stock Average Calculator is simple and hassle-free. Just follow these steps:
- Enter the Quantity: Input the number of shares purchased.
- Enter the Price: Add the purchase price for each stock entry.
- Click Calculate: Instantly get your weighted average stock price, total investment, and total quantity.
Whether you’re a beginner or an experienced trader, our tool provides an easy way to calculate the average down or average up on your stock purchases. No need for complex spreadsheets or manual calculations.
Features & Benefits
- User-Friendly Interface
Our calculator is designed for simplicity and ease of use. No confusing formulas or clutter — just clean, clear inputs and results. - Fast & Accurate Calculations
Get your results instantly. Simply enter your data and see the total cost, total shares, and weighted average price calculated in seconds. - Mobile & Desktop Friendly
Access our calculator from your computer, tablet, or mobile device. Stay in control of your investments from anywhere, anytime. - Multiple Entries Allowed
Did you make multiple stock purchases at different prices? No problem! Add as many transactions as you want and see the real-time calculation of your total average. - Privacy & Security
We respect your privacy. No sign-ups, no downloads, and no data tracking. Your information stays with you. - 100% Free to Use
Our calculator is completely free for all users. No fees, no subscriptions, no strings attached.
What is Stock Averaging?
Stock averaging is an investment strategy where investors purchase additional shares of a stock as its price falls. This reduces the overall average cost per share, providing an opportunity to profit when prices rebound. Averaging down is often used to manage risk, but it’s important to analyze a company’s fundamentals before using this strategy.
Example of Averaging Down:
Suppose you purchase 100 shares of ABC Ltd at $50 each, making a total investment of $5000. The stock price drops to $40, and you purchase an additional 50 shares. The new average price per share is lower than the original $50, which means you’ll break even sooner if the price rises.
Who Should Use the Stock Average Calculator?
- Investors averaging down to lower their purchase price.
- Traders tracking multiple buy-in points for a single stock.
- Long-term investors monitoring cost bases for better exit strategies.
Whether you’re buying dips or diversifying your portfolio, our calculator makes it easy to understand the cost structure of your holdings.
FAQ (Frequetly Asked Questions
Formula for Stock Average Calculation
To calculate the average purchase price of multiple stock transactions, you can use the following formula:
Stock Average Price=(Q1×P1)+(Q2×P2)+⋯+(Qn×Pn)Q1+Q2+⋯+Qn\text{Stock Average Price} = \frac{(Q_1 \times P_1) + (Q_2 \times P_2) + \cdots + (Q_n \times P_n)}{Q_1 + Q_2 + \cdots + Q_n}Stock Average Price=Q1+Q2+⋯+Qn(Q1×P1)+(Q2×P2)+⋯+(Qn×Pn)
Where:
- Q1,Q2,…,QnQ_1, Q_2, \dots, Q_nQ1,Q2,…,Qn = Quantity of shares purchased in each transaction
- P1,P2,…,PnP_1, P_2, \dots, P_nP1,P2,…,Pn = Price per share for each transaction
Example
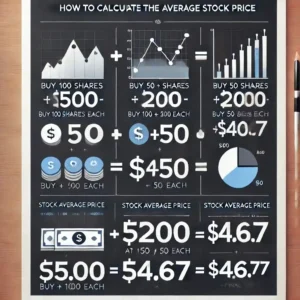
- Buy 100 shares at $50 each → Total cost = 100 × 50 = $5000
- Buy 50 shares at $40 each → Total cost = 50 × 40 = $2000
Average Price=5000+2000100+50=7000150=46.67\text{Average Price} = \frac{5000 + 2000}{100 + 50} = \frac{7000}{150} = 46.67Average Price=100+505000+2000=1507000=46.67
So, the new average cost per share is $46.67.
Images for Stock Average Calculation
I’ll create a few image concepts that visually explain the stock average calculation process.